Why So Many Climate Models?
A Plethora of Climate Models

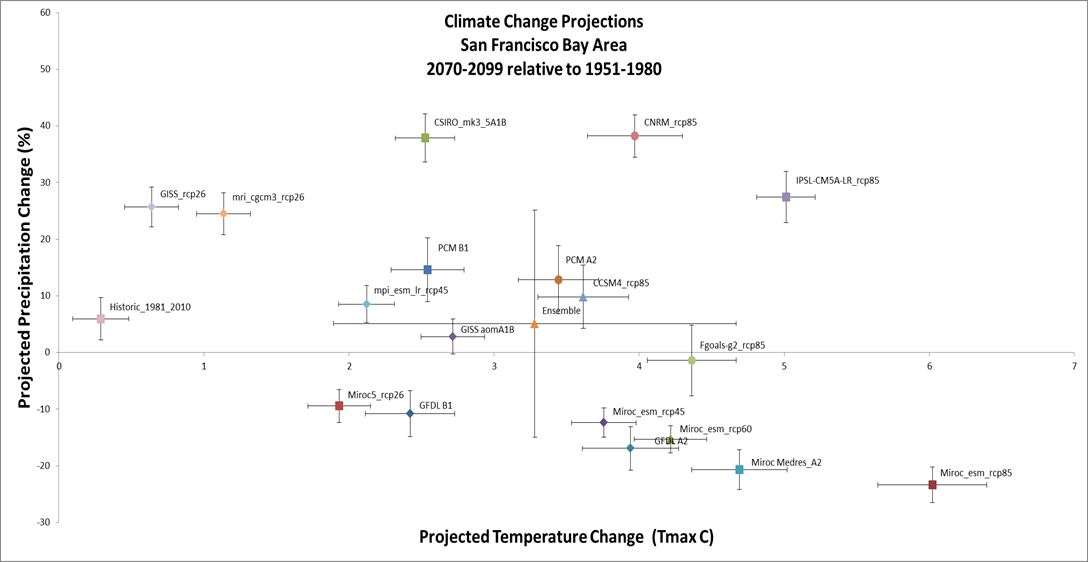
The above figure, which comes from the report High Resolution Climate-Hydrology Scenarios for San Francisco’s Bay Area, amply illustrates the conundrum facing all those who would make use of climate projection data. In this figure, 18 different climate models are represented, with temperature change values ranging from less than 1 degree to 6 degrees increase, and precipitation change values ranging from a 20% decrease to a 40% increase. With such a wide range, what value does one use for planning? Why is there such a plethora of models?
Global Models, A Global Community
One simple answer to the question of why there are so many climate models is that science is a global activity. Around the world, there are roughly thirty research groups that have developed their own global circulation models. While the basic structure of these models is comparable, they all differ in their details. The Earth's climate system is incredibly complicated: to begin with models must portray the physical interactions between the atmosphere, the oceans, land surfaces, and sea ice with respect to a multitude of processes operating on many different space and time scales. Different models make different choices about which elements of the physics to emphasize, for instance by how finely the vertical structure of the atmosphere is subdivided. Different models also have different portrayals of elements of the climate system that are more challenging to model, such as the treatment of clouds, aerosols, or the carbon cycle.
Moreover, all climate models incorporate human activity in the form of greenhouse gas emissions. To develop a climate model that extends a century into the future necessarily means projecting economic activity resulting in greenhouse gas emissions into the future as well. Climate modelers cope with the uncertainties of economic projections (what if the world economy collapses?) by adopting a set of standardized greenhouse gas concentration scenarios (now termed Representative Concentration Pathways, or RCPs), and running the climate models across each scenario in turn. More scenarios means more output projections to consider.
CMIP
The climate science community has recognized for some time the need to standardize upon a set of climate change modeling experiments to help compare the different models and improve our understanding of the climate system. This has been termed the Coupled Model Intercomparison Project (CMIP). The present generation of CMIP models is called CMIP5, since it marks Phase 5 in a successive series of sets of models. This phase is largely complete. Work is beginning on design of CMIP6, but finalized datasets will not be starting to emerge from this new phase until roughly 2017. At present the CMIP5 effort incorporates 62 different models from 29 different modeling groups.
Because there are too many CMIP5 models to compare in most applications, user communities have adopted different strategies to subset the models. The group that produced the above figure, the Terrestrial Biodiversity Climate Change Collaborative (TBC3), used a cluster analysis to identify 18 different models that together captured the entirety of the CMIP5 model space. One clear pattern that emerges from this analysis is a gradient of RCP scenarios, with models representing the mildest RCP scenario (RCP 2.6) arrayed at the left-hand side of the diagram, and models representing the most extreme RCP scenario (RCP 8.5) at the right-hand side of the diagram.
Modeled Futures, Possible Futures
Despite the existence of a wide variety of climate models, there are conceptual problems in treating these as independent entities, amenable to statistical treatments such as averaging or taking standard deviations. To begin with, climate models have a shared history, or in other words a genealogy (Masson and Knutti 2011, Winsberg 2012). There is common code between many of these models. Technical knowledge moves from modeling group to modeling group as scientists relocate. At present we lack a detailed characterization of the shared history of climate models, and it is not at all clear what we do with such a treatment in a statistical analysis sense. It is certainly inappropriate to treat different climate models as randomly sampled independent draws from a hypothetical model space, which is what would be required by rigorous statistical analysis. (Winsberg 2012).
Here are several ideas, not exhaustive, on how to work with the large number of climate models that are available.
1) If one has a reason to limit analyses to a particular emissions trajectory (for example only considering the most extreme scenarios e.g. RCP 8.5), then one need only work with the subset of the available models with that particular emissions trajectory.
2) Conversely, there may be no a priori reason to make such a limitation. Despite examining current trends, it is impossible to predict the social and technological evolution of civilization over the next century, and hence it may be just as valid to consider the most mild emissions trajectory (RCP 2.6) as well as the most extreme trajectory (RCP 8.5).
3) Because of the conceptual problems in treating sets of climate models as statistical ensembles, one is not justified in looking for a central tendency in these models; rather, one should consider all the models as possibilities.
4) Finally, entertain the notion that the actual future lies outside the entire set of the modeled futures, since the models themselves represent only limited explorations in a potentially huge conceptual space. Caveat emptor.
For additional reading, please click on the subject links below.
6/2015
